Field Note #001
How We Read a Website Like a Map, Not a List
How a Digital MRI works: we crawl a site, turn it into a graph of pages and links, and read its structure through five lenses. Method only, no client data.
Why a list is the wrong mental model
Most people picture a website as a list: a homepage, an about page, a handful of product pages, a blog. That model is comfortable and almost always wrong. The pages are real, but the thing that decides whether anyone (a person, a search crawler, or an AI agent) ever reaches a given page is not the page itself. It is the links between pages.
Change the links and you change the site, even if every page stays exactly the same. Move a product page so that nothing on the site points to it, and it becomes invisible to anything that discovers content by following links, no matter how good the page is. The page is still there. The path to it is gone.
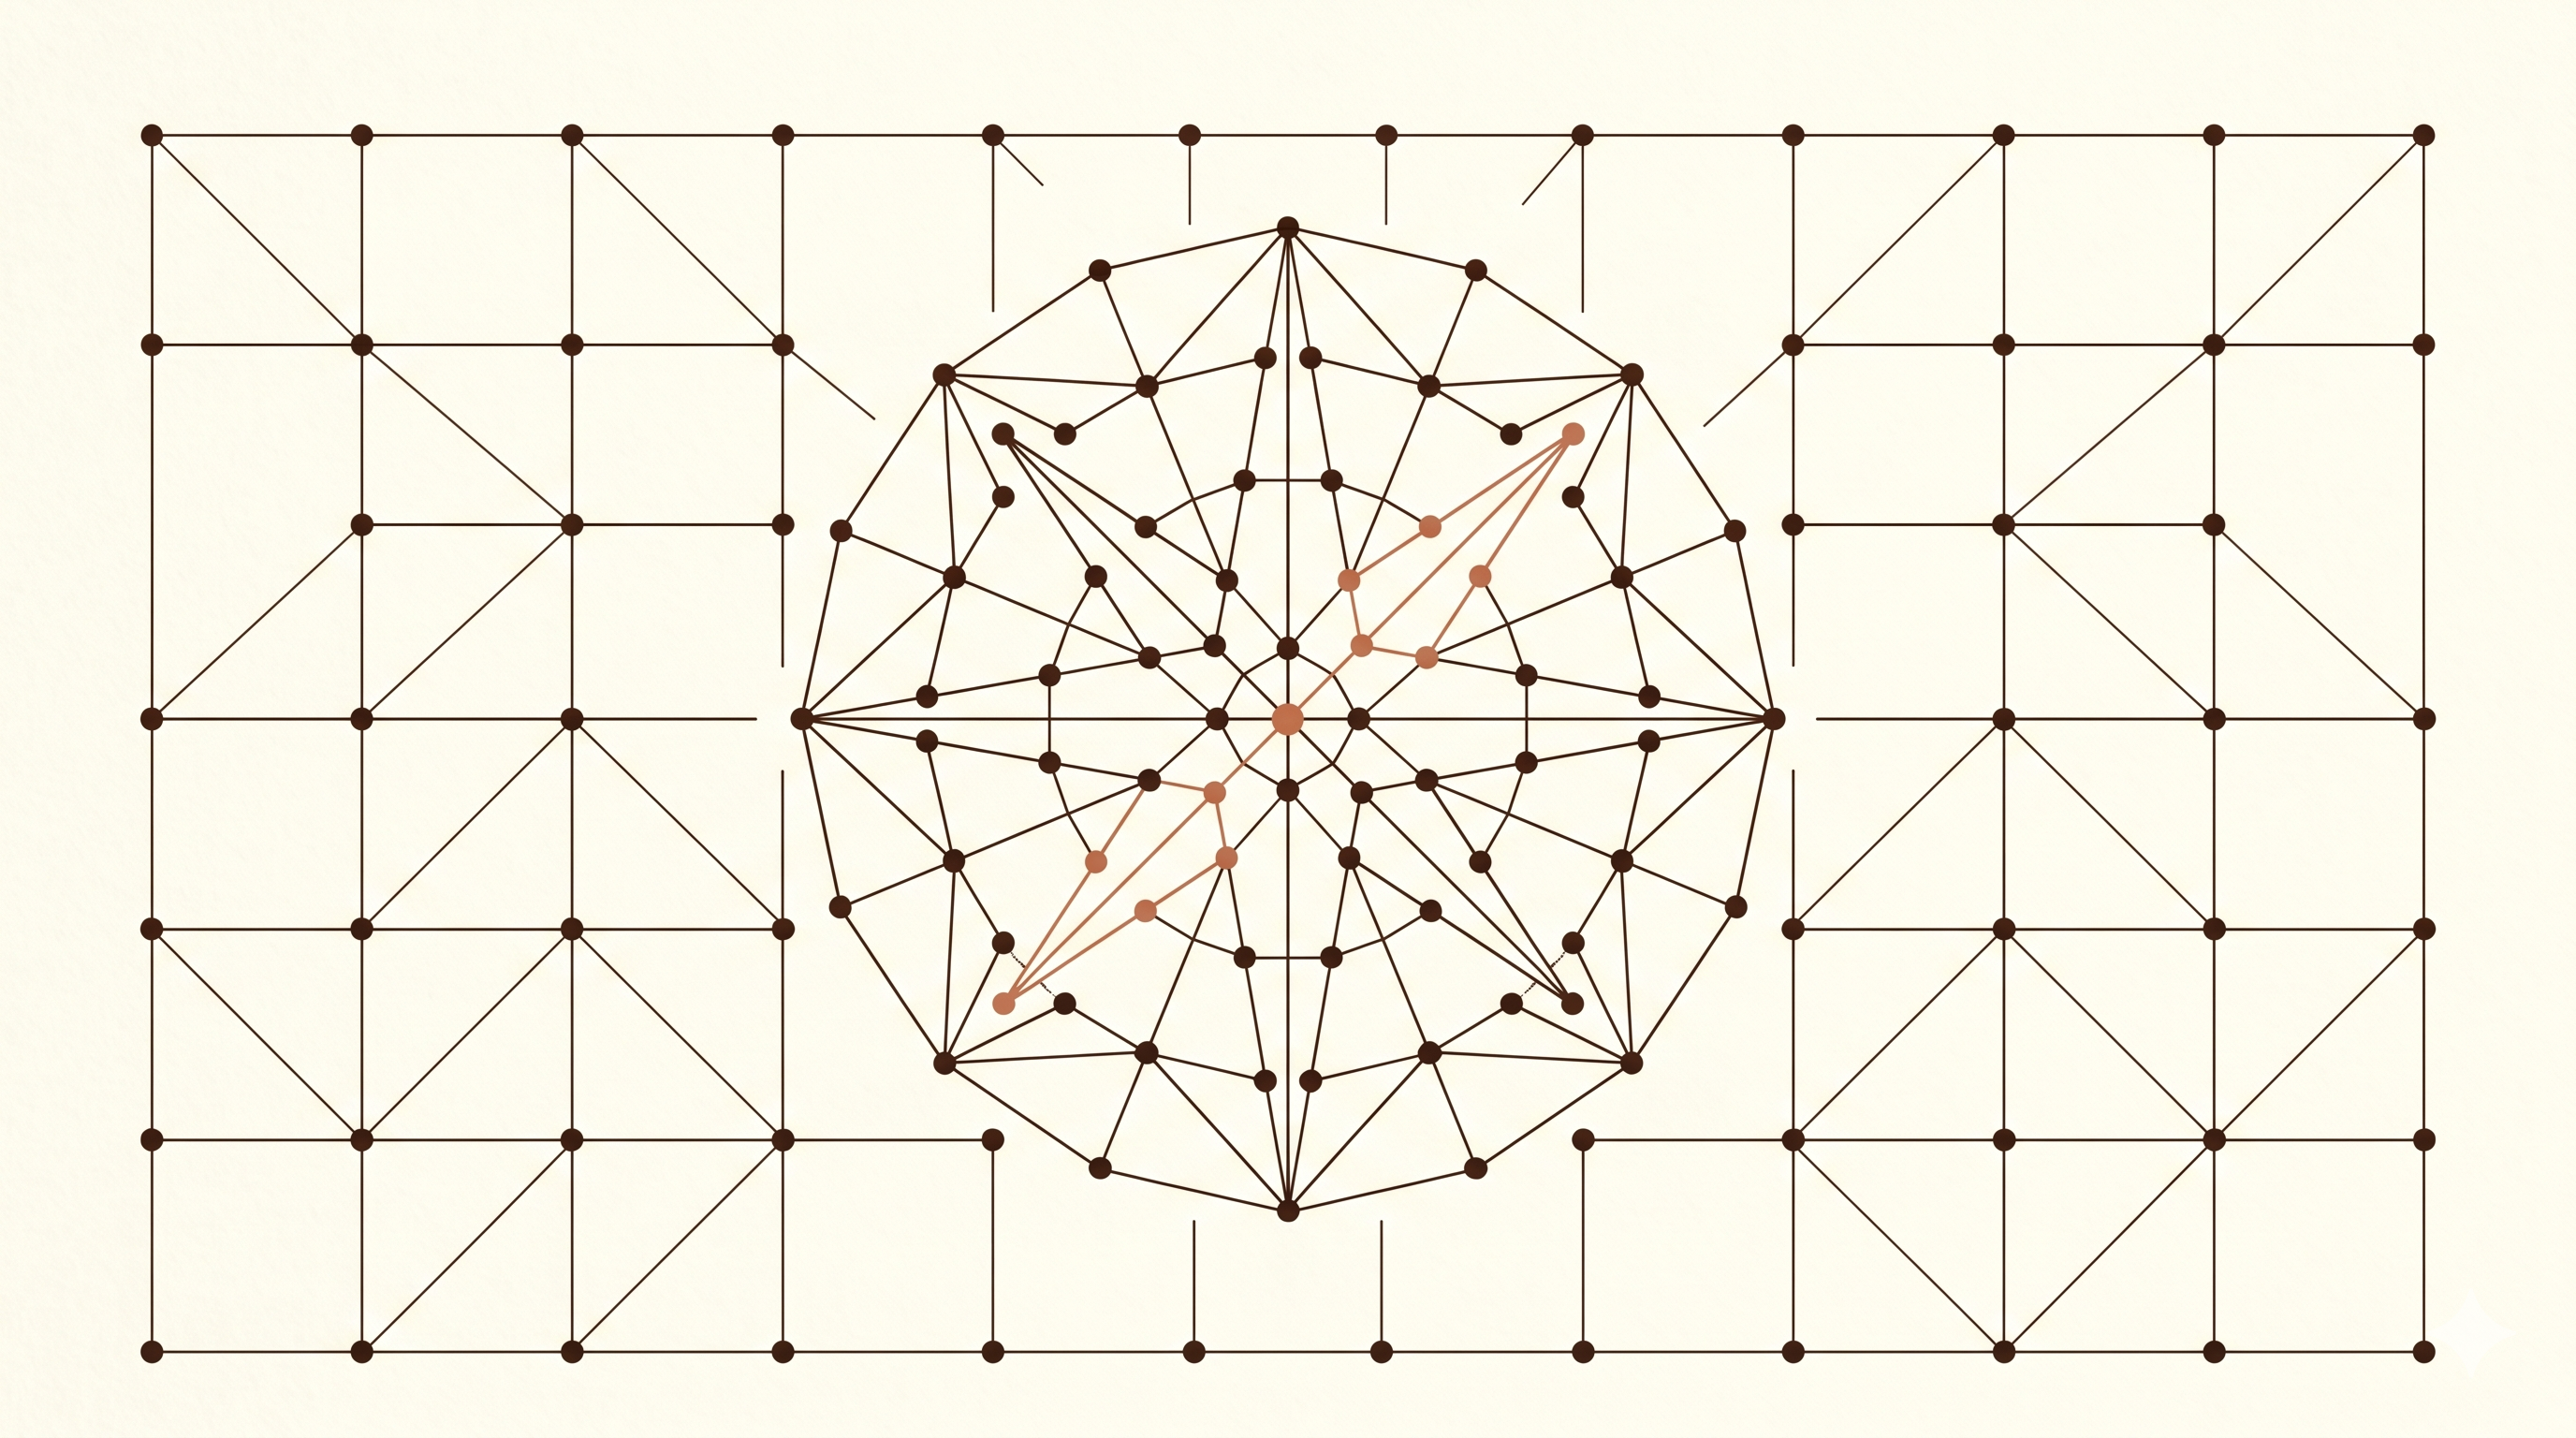
So we stop treating a site as a list and start treating it as a graph: a network of pages connected by links. Once a site is a graph, we can measure its shape, and the shape turns out to predict a great deal about how the site performs in an AI-driven search world. We call the full version of this analysis a Digital MRI. This note walks through how it works.
Step one: the crawl
Everything starts with a crawl. Our crawler (we call it ARGUS) works through the site page by page, adapting how it reads each one so that no page and no link gets missed. Different pages are built in different ways, so ARGUS uses whichever approach fits each page best, then records what it finds: which pages exist, and which pages link to which.
A few rules govern the crawl:
- We respect the site’s robots directives. Pages the site marks as disallowed are never fetched. They are not part of the analysis.
- We read the main content, not the chrome. Every page on a site repeats the same navigation menu, header, and footer. Those are not editorial decisions about what relates to what; they are the building’s plumbing. We extract the main content of each page and set the boilerplate aside.
- We collect structure, not data. We record which pages exist and which pages link to which. We do not collect personal data or user information. The output is a map of public page structure.
Step two: from pages to a graph
Once the crawl is done, we build the graph. This part is simple to state:
- Every page becomes a node.
- Every in-content link from one page to another becomes a directed edge.
The word that matters is in-content. Every site really has two link layers: the global navigation that repeats on nearly every page, and the editorial links an author deliberately placed in the body of a page to point at a related page. We collect both, because each tells us something different and we want the whole picture. But for measuring structure we rely on the editorial layer: if we let the navigation menu count, it would connect almost everything to almost everything, and the graph would be a meaningless blur. We keep both datasets and use whichever one best fits the metric we are measuring.
That editorial graph is the real skeleton of the site. It is also what a link-following AI agent actually traverses when it tries to understand a brand by clicking through it.
Step three: the five lenses
A graph of a few hundred pages is too big to read by eye, so we measure it. We look through five lenses, each answering a different question about the site’s health.
| Lens | Question it answers |
|---|---|
| Skeleton | How big is the site, and how densely is it connected at the body level? |
| Circulation | How does importance flow between pages, and how few pages hold the whole thing together? |
| Organs | Does the content cluster into clear topical neighborhoods, or is it one undifferentiated mass? |
| Health | How many pages are stranded? Orphans with nothing pointing to them, dead-ends that point nowhere. |
| Nervous System | Do the topical neighborhoods link across to each other, or does each silo stay sealed? |
Behind these lenses are standard network-science measures: PageRank for how authority concentrates, community detection for the topical neighborhoods, betweenness centrality for the load-bearing pages that everything routes through. The lenses are how we make those measures legible.
What the measurements keep finding
Two patterns show up again and again, across very different sites and industries.
Orphans and dead-ends are independent problems. An orphan is a page with no inbound editorial link: it exists, but nothing points to it. A dead-end is a page that receives links but offers none of its own: you arrive and the trail stops. The intuition is that these are the same flaw. They are not. A site can have almost no orphans and a third of its pages dead-ending, or the exact reverse. Fixing one does nothing for the other.
Connectivity concentrates in a handful of pages. On many sites, a small fraction of pages sit on a large share of all the paths through the graph. Remove those few pages and the site fragments into disconnected pieces. That concentration is a fragility: the whole site’s navigability depends on a few hubs, and if those hubs are thin or off-topic, everything downstream inherits the problem.
Why this matters for AI search
There are two ways automated systems consume a site, and the graph affects them differently.
Indexer crawlers (the bots behind search engines and AI training) often read the site’s XML sitemap, so they can reach pages even when the editorial link structure does not lead there. Agentic browsing, where a model follows links in real time to answer a specific question, is different. It does not pre-load a sitemap. It traverses what is editorially linked from wherever it lands. For that second mode, a page with no editorial path to it simply does not exist.
This is why structure is the signal. A site can be full of excellent content and still answer an AI agent’s question with whatever happens to sit on its few load-bearing pages. The fix is rarely more content. It is structural: rescue the orphans into their neighborhoods, close the dead-ends with links to related pages, and spread the connective load so the site does not hinge on a handful of hubs.
That structural work is exactly what a Digital MRI maps and what the rest of this series demonstrates. The episodes take that lens to a single site at a time; the industry reports aggregate it across a whole cohort. This note is just the method underneath all of it.
A note on method:
The crawler respects site-level robots directives; disallowed pages are never fetched. We record both the global navigation and the in-content editorial links, then use whichever dataset fits each metric. For structural analysis, link targets that recur as site-wide navigation are identified per site, using a threshold adapted to each site rather than a fixed cutoff, and set aside so the structural graph reflects only in-content editorial links. Analysis uses standard network-science methods including PageRank, Louvain community detection, and betweenness centrality. All data represents publicly accessible page structure only. No content, metadata, or user data is collected or stored. This note describes our general method and does not reference any specific site or client.